Top vs Bottom · BE
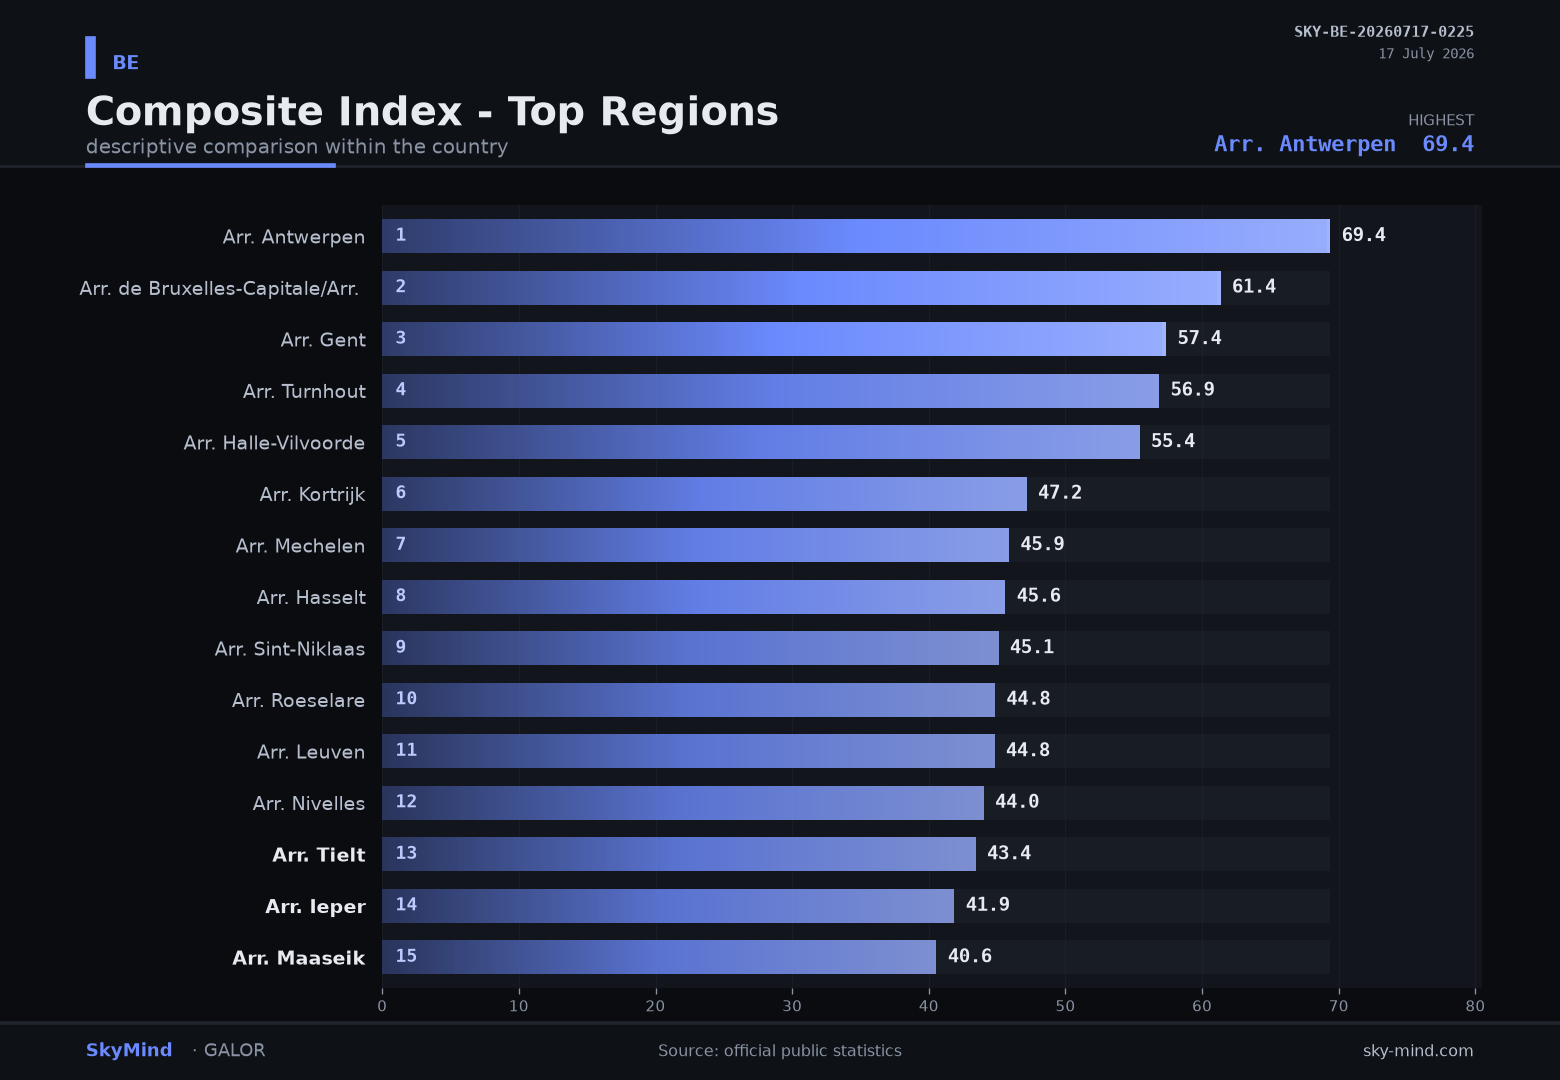
The gap between Belgium's top arrondissements and the bottom — wider than you might guess. (Top vs Bottom)
The top-3 arrondissements in Belgium average 62.7; the bottom-3 average 18.8. That is a 43.9-point gap inside one country — the kind of within-country spread that national headlines tend to flatten.
SkyMind tracks official Eurostat indicators official indicators — each min-max normalised within Belgium. The methodology is fully open and reproducible from public source data (Eurostat NUTS-3), with no defaults and no carried-forward values.
We also scan the data for anomalies, clusters and metrics that move together — flagging which regions break the pattern.
How it works: GALOR collects public-source data across arrondissements in Belgium and makes it comparable. SkyMind is the product on top — daily updates, open methodology, transparent scoring.
Flandre vs Wallonie — not just politics, but economic reality. Bruxelles sits between them. Three regions, three economies.
Explore the data: sky-mind.com | sky-mind.com/map.html
Note: this is a descriptive, within-country comparison — not a forecast. Compare Belgium's arrondissements against each other, not across countries. Public data only, zero personal data.
#SkyMind #GALOR #RegionalData #OpenData #DataScience #Belgium