Axis Spotlight · DE
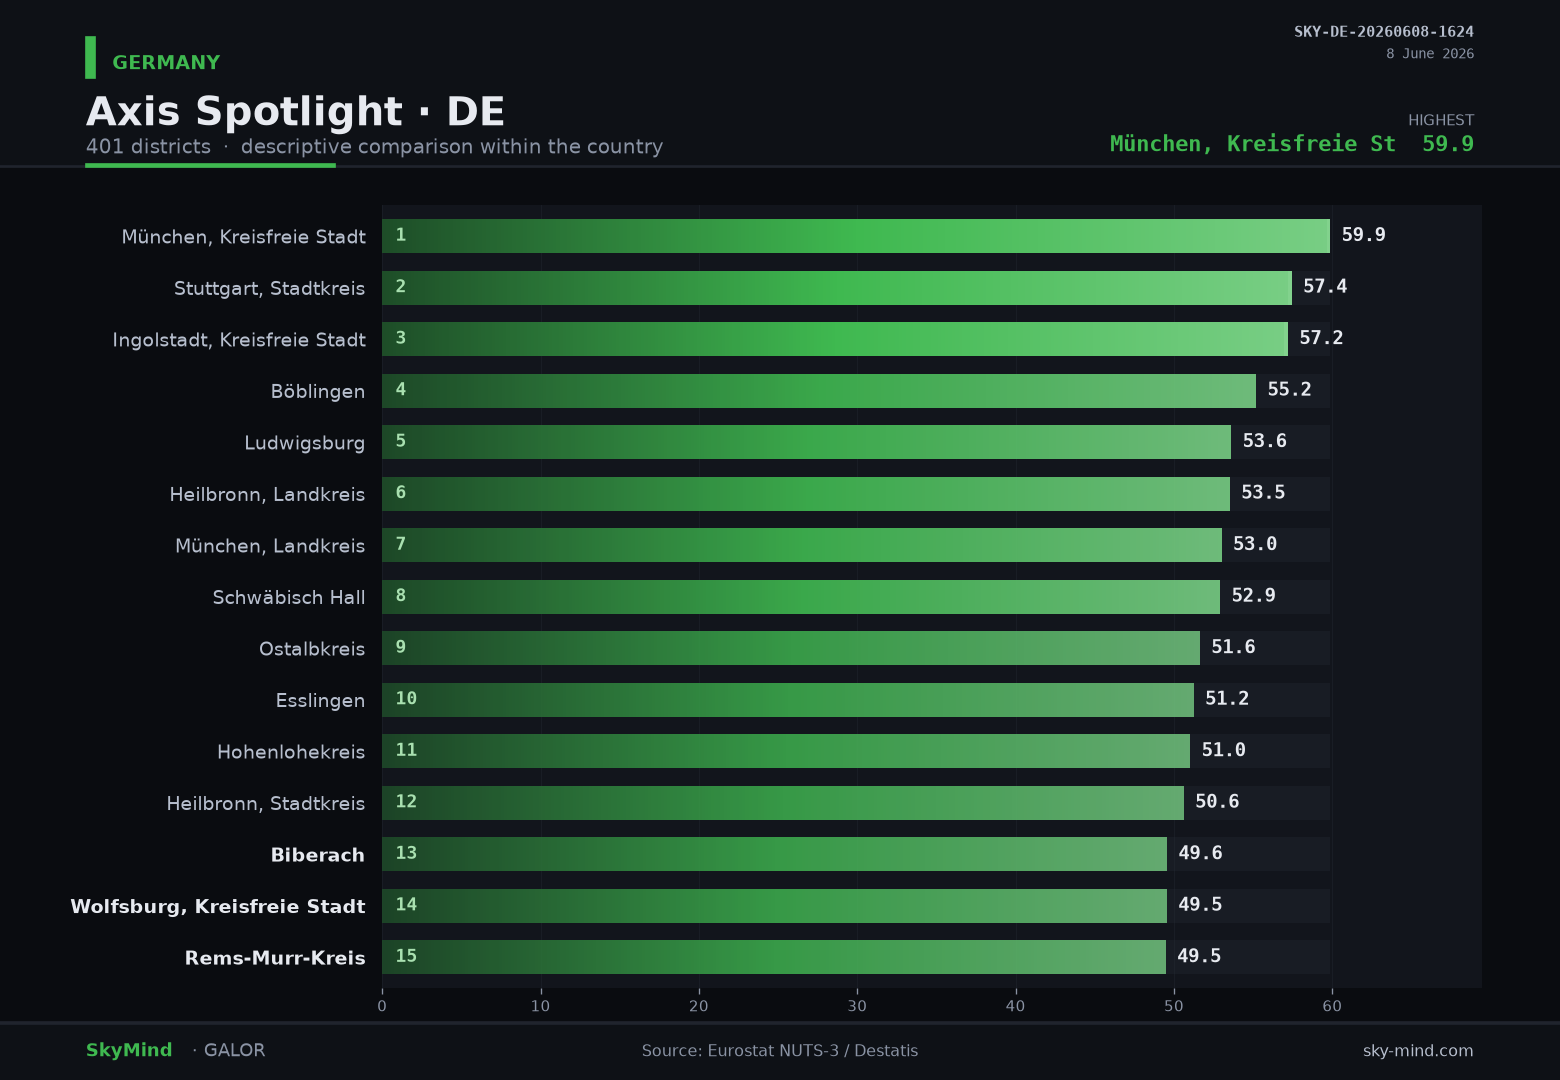
Which axis carries Germany this week — economic, demographic, or social? (Axis Spotlight)
The official data aggregates 143 metrics into three categories — economic, demographic and social/infrastructure — each min-max normalized, then. It is reproducible from public source data (Eurostat, Eurostat NUTS-3), with no defaults and no carried-forward values.
Our ML layer scans the same data for anomalies, clusters and the metrics that move together — flagging which regions break the pattern.
How it works: GALOR collects public-source data across 401 districts in Germany and makes it comparable. SkyMind is the product on top — daily updates, open methodology, one index.
Germany's east–west and urban–rural divides show up clearly in the district data.
Explore the data: sky-mind.com | sky-mind.com/map.html
Disclaimer: SkyMind describes how Germany's regions compare on public data today — it does not predict events or outcomes. Methodology is open at sky-mind.com/methodology.
#SkyMind #GALOR #RegionalData #OpenData #DataScience #Germany