Regional data you can defend
Before a number goes in front of your board, you need to know it holds up. SkyMind is built around one question — "where does this come from?" — answered for every figure, across 47 countries.
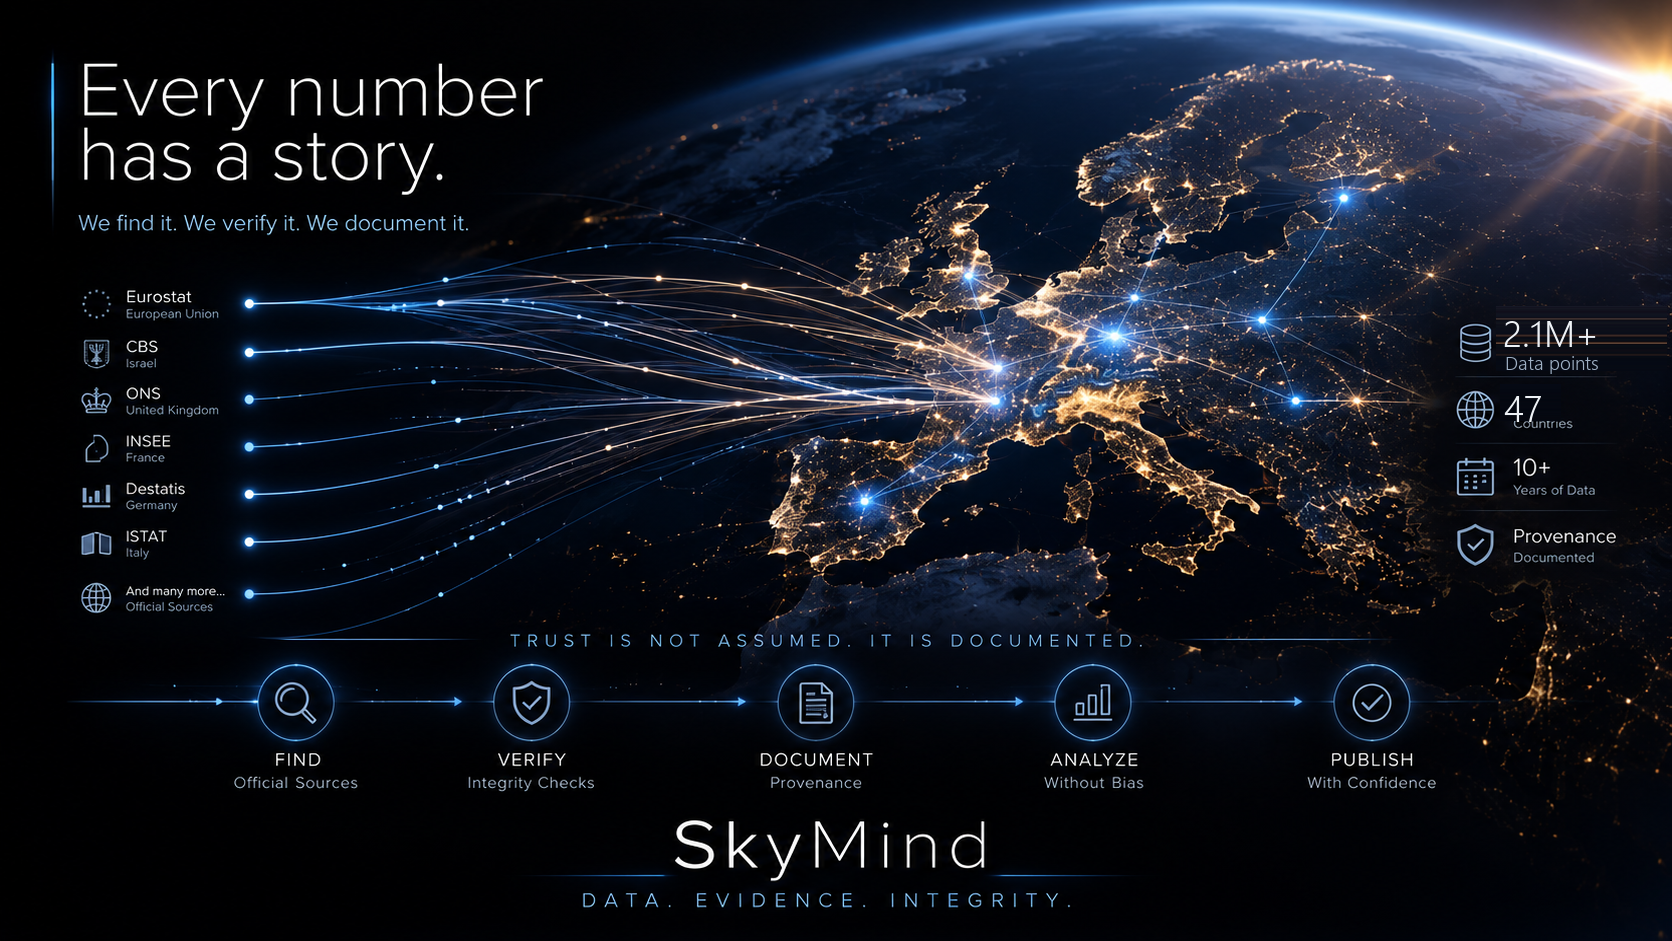
What you're actually buying
Not the data — most of it is public, published by national statistics offices anyone can download. What's hard, slow, and expensive is everything around it: pulling dozens of government sources, reconciling geography, normalizing inconsistent metrics, forcing it all into one comparable schema, and keeping it current.
You're buying the guarantee that the dirty work is done — and that you can check it.
That's the same thing Bloomberg, S&P and FactSet actually sell. The value isn't a secret algorithm. It's: "if the figure is in here, you can stand behind it."
Five things we guarantee
Every figure traces back to a national statistics office or official open-data portal — Eurostat, INSEE, CBS, GASTAT, data.gov.il, Dubai Land Department, PSA Qatar, the World Bank. The small number of derived or estimated values are labeled as such — never disguised as measured. We'd rather show you the seam than hide it.
SkyMind is descriptive. It shows the measured state of a region from official data. It does not predict events, score "risk," or claim to see the future. We retired a predictive engine in May 2026 after it failed our own honesty tests — the absence of magic is a feature.
Every raw figure is the official published value — pull it from the source agency and you get exactly the same number. Our scoring methodology is transparent and reproducible: min-max normalisation within a country, documented openly. If a figure doesn't match the source, that's a bug and we want to hear about it.
A district in Germany sits in the same comparable structure as one in Qatar — same English labels, same units, same unified schema, every figure cited to its source. Cross-country comparability isn't an afterthought; it's the whole point.
Every country's sources are documented today (below). We're extending that to per-metric, clickable lineage — source, agency, original indicator code, update date — metric by metric. We'll ship it when it's true for all 47 countries, not before.
How a figure resolves to its source
Five layers, top to bottom. Nothing is added on the way down.
/data/provenance returns the verified country-level source marked source_level="country" — a coarser answer, never a fabricated one. That is the gap guarantee 05 above is about. Revision-log coverage begins 13 July 2026, when the triggers were installed.Where every number comes from
Country-level sourcing is complete and public. This is the backbone the per-metric lineage is built on.
| Country | Coverage | Official sources |
|---|---|---|
| 🇩🇪 Germany | 401 Kreise | Eurostat NUTS-3 |
| 🇮🇱 Israel | 255 localities | CBS (Lamas) · data.gov.il |
| 🇦🇪 UAE | 340 units | Dubai Land Department · Dubai Statistics Center · World Bank |
| 🇸🇦 Saudi Arabia | 51 governorates | GASTAT · World Bank · Census 2022 |
| 🇶🇦 Qatar | 8 municipalities (official) | Qatar PSA (data.gov.qa) · World Bank |
| 🇫🇷 France | 96 departments | Eurostat NUTS-3 · INSEE |
| 🇪🇺 EU & neighbours | 29 countries · 1,014 regions | Eurostat NUTS-3 + national offices for GDP (BFS, CSB, CBS, INE, StatFin, SSB) |
What we do not claim
- We don't predict. No event forecasting, no "risk scores," no probabilities of the future.
- We don't own the data. It's public — and that's the point. You can verify us against the primary source. The work we did is the unification, not the collection.
- We don't pretend every value is machine-measured. Derived and estimated figures are labeled as derived.
- Our methodology is transparent and reproducible. The numbers are the statistics offices' official figures, cited. You pick which official metric to look at, and every step is documented openly.
The standards behind this
None of the above is our invention — it's the discipline official statistics already lives by. We mapped SkyMind point-by-point to SDMX (ISO 17369), the European Statistics Code of Practice (all 16 principles) and the FAIR principles, plus the Gulf open-data frameworks — with a checkable proof link per claim, and the places our own rules are stricter. See Standards & conformance.
And rather than asking you to take the discipline on faith, we put it on screen: an interactive replay of a real ingestion — the validation battery running check by check on actual values, and the load gate refusing the data when a synthetic value is injected.
The bottom line
The honest question isn't "why trust SkyMind?" — it's "how long would it take me to build this myself?" Dozens of sources, unified geography, one schema, kept current, every figure checkable. For most teams that's 6–12 months of an analyst's time. We've done it for 47 countries.
If a figure is in SkyMind, you can defend it.